
 Merch
Merch Medical card
“Every company’s financials are just a reflection of its operating narrative. The data answers: ‘How is my business performing?’ and more importantly, ‘Why is it performing that way?’ And what can I do about it?”
The Cannabis Conundrum
Stop me if this sounds familiar: you’re a cannabis operator in 2025, and despite growth from new market expansion your business is facing the same challenges it has for the last decade.
Margins are compressing fast in your home market. You’re discounting more than ever to compete for and hold shelf space in a new one.
While expansion markets are an organic method of growing brands, each market comes complete with their own regulatory and market specific way of doing business (most often a carryover from Medical regulations or because of ever-changing regulatory environments).
Everywhere you turn, the same story repeats:
- High price pressure in mature markets
- A race to the bottom just to get listed in new ones
- Deep discounting, promo stacking, and in-store credits are sales team’s only weapons
- Very little clarity on how the consumer is actually behaving at retailers
Meanwhile, you’re trying to make sense of it all from:
- POS data (when you can get it)
- Spreadsheets from your distributors
- Changing compliance systems
- And an ERP system that wasn’t built for cannabis
- New markets bring new headaches: new regulations, unfamiliar retailers, and even more fragmented data. You’re stuck making decisions in the dark.
But buried inside the chaos is a signal. A pattern. A lever you can pull.
It’s called Volume, Mix, and Rate (VMR) analysis — and it helped me turn noise into narrative.
Discovering VMR
In 2017, I was a new Finance controller for Amazon’s Global IT department, swimming in a sea of acronyms and convinced I was the dumbest person out of the 150,000 employees there. The impostor syndrome was real.
But I was lucky. I had access to some brilliant, pedigreed mentors who took the time to show me something that would fundamentally change the way I look at a business: the power of a volume, mix, and rate analysis (or PVM as traditional finance professionals call it. Here’s a quick primer on PVM)
They helped me see that inside every company’s financial data is a pattern, a story, a lever to pull. Fast forward seven years, through the chaos of cannabis operations, volatile pricing, and fragmented tech stacks, and I now know that this simple framework might just be the most powerful tool cannabis operators have at their disposal.
Let’s break it down: Volume, Mix, Rate (VMR). Here’s how I explain it to clients:
| Term | What It Means | Why It Matters |
|---|---|---|
| Volume | Units sold | Are you scaling demand? |
| Mix | What you sold (SKUs/types) | Are you shifting to better-margin items? |
| Rate | Price/unit sold (net of promos) | Are you gaining or losing pricing power? |
And while these are important definitions, where it becomes useful is when we start to track and understand the change in these figures period over period.
VMR is a critical component of “explaining the change” and isolating each element’s individual impact on performance.
Once you start understanding how each element is impacting revenue, you can’t unsee it the usefulness of this analysis across every account in a P&L (profit and loss aka income statement) – more on VMR next week.
Using VMR in Real Life
Let me show you what I mean. I used ChatGPT to simulate a multi-state cannabis brand that manufactures both gummies and pre-rolls. I prompted it to generate realistic wholesale order data across four quarters, with sales to 10 retailers across 15 states. The product catalog included three tiers of pre-rolls and three tiers of gummies, each with different list prices and varying levels of promotional activity like discounts and in-store credits.
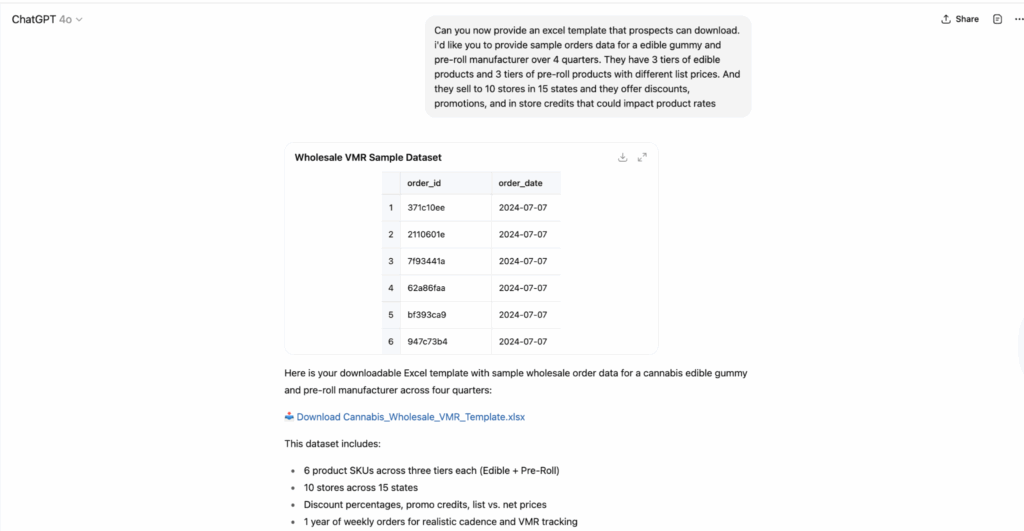
You can actually see the full prompt and output in the screenshots below — and I’ve bundled the results into a downloadable template so you can explore it for yourself.
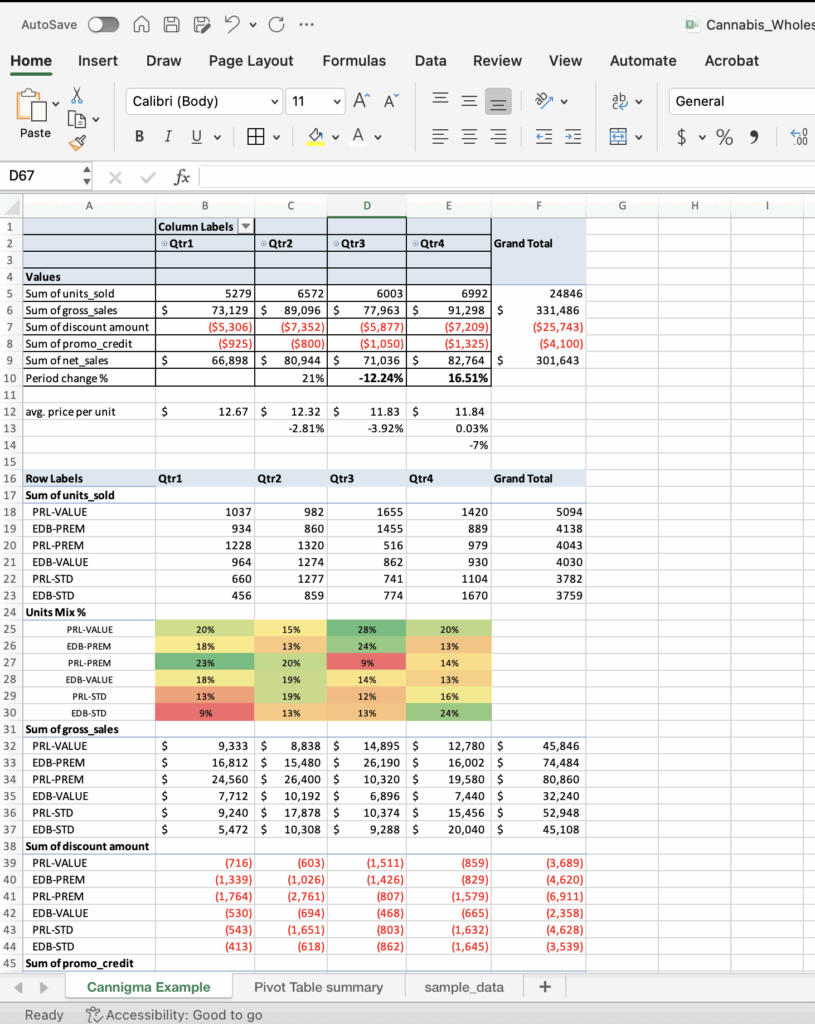
From there, I ran a Volume, Mix, and Rate (VMR) analysis to explore how very broad buckets of discounts/credits impacted revenue quarter over quarter.
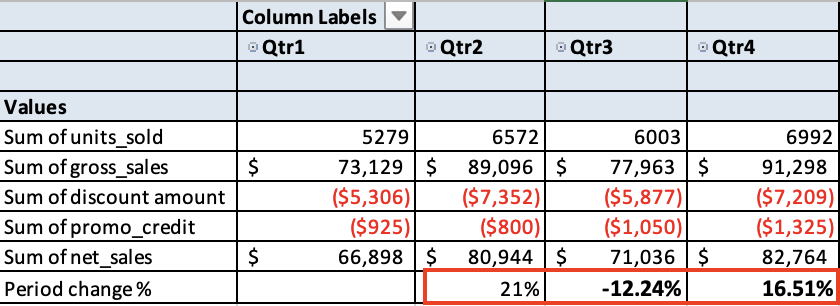
The most revealing story came between Q2 and Q3:
Revenue dropped 12.24%, and the culprit wasn’t just one thing. Volume fell, mix shifted toward lower-value SKUs, and pricing pressure started to show up in subtle ways — more discounts, more credits, more friction.
| Metric | Q2 | Q3 |
|---|---|---|
| Units Sold | 6,429 | 6,003 |
| Revenue | $89,092 | $77,963 |
| Revenue Growth | -12.5% |
- Volume Effect: -$10,638 → fewer units shipped
- Mix Effect: -$539 → mix shifted toward our tier 3 “value” products and away from our Premium edible most acutely (keep in mind this is only margin based on discounts and credits — not including COGS)
- Rate Residual: -$48 → some underlying pricing weakness
This is what price compression looks like in your data.
Now compare that to Q3 to Q4:
Revenue rebounds — up 16.51%, but it’s all volume. Retailers bought more, but the pricing didn’t improve much. A mix gain helped slightly, but margin pressure remained.
| Metric | Q3 | Q4 |
|---|---|---|
| Units Sold | 6,003 | 6,992 |
| Revenue | $77,963 | $91,298 |
| Revenue Growth | +17.1% |
- Volume Effect: +$12,844
- Mix Effect: +$490
- Rate Residual: $0
That’s VMR in action — surfacing not just how performance is changing, but why.
Without this lens, we would’ve celebrated Q4’s bounce without seeing that our pricing power hadn’t recovered. When we looked closer at the mix shift, we saw a change in the average price per unit driven by a heavier tilt toward tier 3 ‘value’ products. While this analysis gave us a good read on our revenue mix, it’s only part of the story.
To get the full picture — and understand true product profitability — we also need to layer in Cost of Goods Sold (COGS) by SKU. Because if a tier 2 product has only a slightly lower volume but a much better margin than tier 3, you might be sacrificing long-term profit for short-term sales.
That’s where VMR meets product strategy: helping us spot which SKUs to promote, which to prioritize in production, and which might be quietly burning margin behind the scenes.
Once you’ve mastered the basics of volume, mix, and rate, you can begin using them for more advanced decision-making across your business. Understanding state, brand, retail, and or vendor mix is just as important as understanding your sales mix, and that is just scratching the surface as you start applying it to your cost centers.
When to Launch a New Product: Use VMR + Market Signals
New product innovation is vital, but can be risky. Before launching, look for:
- Category whitespace → What % of market sales does this category represent vs. your brand’s share?
- Positive price elasticity → Do premium versions in this category command higher price per unit? Are consumers trading up?
- Retailer demand signals → Are your key accounts requesting this SKU profile (e.g., solventless gummies, high-dose caps)?
- Mix lift potential → Will this add margin or cannibalize it?
Ask These Questions with VMR:
| Question | Use VMR to Answer |
|---|---|
| Is my promo strategy profitable? | Did it drive volume or just cut rate? |
| Which products are worth keeping? | Do they add mix value? |
| Should I launch a new SKU? | Does the forecast lift rate or mix? |
| Why are my costs rising? | Is it volume growth or inefficiency? |
| Are we over-relying on discounting? | Look at rate impact month over month |
Chaos to cadence
While this example is a neat AI generated example, as a cannabis brand, you understand the reality of DRIP – being data rich and information poor.
In a perfect world, retailers would provide you clean, timely access to sell-through data, every state would manage compliance the same way, distribution would be affordable at scale, and all of your data would be perfectly centralized and automated, but that’s rarely the case. So instead of waiting, you can start mining your own sales data for signals.
Instead, let’s look at how we can start using your sales cadence as a signal:
| Cadence Signal | What It Might Mean | Metric to Track |
|---|---|---|
| Shortening Reorder Intervals | SKU is turning faster at retail — strong sell-through | Days Between Orders ↓ |
| Slower Reorders | Inventory is sitting; promo may be needed | Days Between Orders ↑ |
| Decreasing Order Quantities | Retailer losing confidence or shelf space | Avg. Order Size ↓ |
| Constant Orders but More Discounts | Price sensitivity increasing; risk to pricing power | Discount % of Order ↑ |
| Promo Response Decays Over Time | Promotion losing effectiveness | Volume During Promo vs Baseline |
Even without advanced tech, you can build a simple wholesale VMR dashboard using:
- Wholesale order exports (CSV or API)
- Weekly or monthly aggregation
- Pivot tables for:
– SKU unit volume
– SKU price (post-discount)
– % of orders by SKU category
Then:
- Track month-over-month change
- Assign tags: ? (healthy), ? (watch), ? (at risk)
- Use cadence to prioritize sales follow-ups
What Operators Should Do Today
- Run a Monthly VMR Report
Start with your top 10 SKUs. Compare this month vs last. Use simple formulas to isolate Volume, Mix, and Rate. - Track Inventory-Linked Margin Loss
Use VMR alongside sell-through data. High volume but declining margin? Time to optimize reordering and pricing strategy. - Align GTM Strategy with State Mix
Deploy promotions or new products in states where Rate and Mix are favorable. Don’t chase volume blindly in saturated markets. - Build VMR into Your Forecasting
Add a VMR module to your revenue model. Use it to pressure-test expansion assumptions and pricing decisions.
The Final Takeaway
I used to think gross margin was the whole story. But VMR taught me to look up and down the P&L to find where money hides.
In cannabis, gross margin is the battlefield. But Volume, Mix, and Rate is the strategy.
With regulatory uncertainty, limited capital access, and pricing compression, company growth won’t come exclusively from market expansion, more headcount, or new tools. It will come from better decisions using the data you already have.
If you’re an operator trying to grow, retain margin, and stop guessing, VMR is your compass.
Let your data speak. Listen closely. And let me know if you want help finding the story it’s trying to tell.
Dom offers services through The Cannigma Creative – Let’s Unlock Your Narrative
Dom works with founders and operators to enrich data and identify strategic growth opportunities, increasing revenue and margin. Connect here.


Sign up for bi-weekly updates, packed full of cannabis education, recipes, and tips. Your inbox will love it.