
 Merch
Merch Medical card
Price Compression Isn’t Coming…..It’s Here
The cannabis industry loves to talk about growth: new markets, new dispensaries, new licensees. But the truth, and the uncomfortable reality most operators are living through while waiting for banking or federal legalization, is that every maturing cannabis market eventually becomes a race to the bottom.

You can see it clearly in market data, and the story repeats state after state:
Uncapped licenses/canopy space → Oversupply → Consumer demand peaks → Falling prices → Margin erosion → Operator consolidation

During my time at the largest wholesale tech company in cannabis, I developed a Market Maturity framework that clearly and visually summarizes this phenomenon. Medical markets evolve (or devolve depending on your perspective) into adult‑use markets, and ultimately into long‑term maturity where prices fall, inventory surges, and only the most efficient operators survive.

This pattern is now widely documented, and it’s driven by a mix of regulatory, economic, and structural forces, the biggest of which is the oversupply that occurs when licenses or cultivation canopy are left uncapped.

As long as interstate commerce remains prohibited and operators are forced to sell only within state borders (for a deeper look at why this still is, check out Vanderbilt’s case study here), supply and demand become closed loops. Every operator grows inside a box that slowly fills with more product than consumers can absorb (this, of course, does not account for any purchases from the plug down the street either), resulting in operators defaulting to discounts and BOGO offers as their way to keep products on shelves.
Massachusetts: A Real‑Time Picture of Price Compression
Massachusetts is a perfect case study, one of the most transparent with their cannabis sales data one of the most transparently available thanks to MA’s open data portal.
1. Adult‑Use Sales Plateau
Despite more stores and more operators, the state now sees monthly sales plateauing around ~$135M. Demand is no longer growing fast enough to absorb additional supply, which is the first sign of transition into the “race to the bottom.”

2. Plant Supply Continues to Surge
While sales flatten, cultivation activity continues to rise sharply demonstrating the classic imbalance: too much inventory entering the system once it has already reached consumer saturation.

3. Retail Flower Prices Collapse
The result? The retail price per gram has fallen from $14–$16 to under $4.50 in just a few years. With prices falling ~70% and still trending downward, operators face shrinking margins and rising operational pressure.

The Race to the Bottom: Why Most Operators Aren’t Prepared
Price compression itself isn’t new, it happens in every commodity‑driven market. What is new is how poorly prepared most cannabis operators are to withstand it.
And it’s not because of bad farming or poor product quality, but rather the hidden costs of doing business:
- Compliance overhead
- Labor inefficiencies
- Manual reporting cycles
- Fragmented financial systems
- Broken SOPs and duplicated workflows
- METRC tag overuse
- Excess packaging costs
- Vendor mismanagement
- And most concerning, non-scalable tech stacks held together by spreadsheets
In cannabis, these operational leaks stack up until they become the difference between surviving and shutting down.
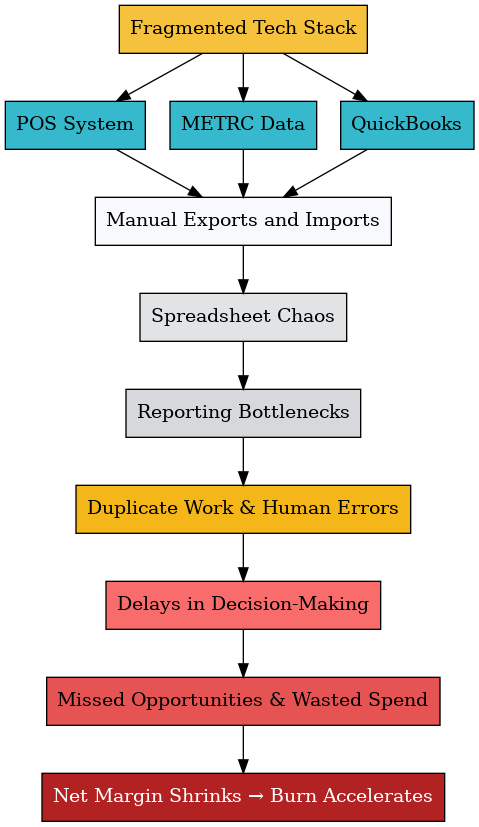
When Growth Masks Inefficiency
Most operators build their businesses for growth.
- A new license in a new state? → Add an LL, METRC, & QuickBooks account.
- A new SKU? → Add a spreadsheet tab.
- A new sales channel? → Add another team (labor) to pull data from the POS and ERP systems.
Then, these variable costs (mostly in labor and low‑efficiency tech workarounds) stay on the books even when revenues plateau or decline. In other words, you scaled up for growth, but you didn’t scale down for survival!
Without integration between finance, compliance, inventory, and reporting systems, teams are forced to throw bodies at problems. During a downturn, that human capital becomes a silent margin killer.
You Might Be Scaling with Spreadsheets if…
- You learn about operational mistakes 2 weeks after they happen.
- You have 10+ QuickBooks files to manage across licenses or entities.
- You need 3+ people to prepare monthly sales or finance reports.
- You’re copy/pasting from METRC → Excel → Google Sheets → PDFs → Email.
- You don’t trust your COGS or gross margin by SKU.
- You’re running multiple disconnected tools for POS, ERP, CRM, and inventory.
- No one has time to analyze the data (because everyone is chasing the data).
- You send screenshots to your CEO instead of real-time dashboards.
- You’re still paying for tech you don’t fully use (or can’t connect).
Scaling with spreadsheets might have worked in the early days, but in a mature market, it’s death by a thousand cuts.
In cannabis, these hidden costs stack up until they become the difference between surviving and shutting down. Don’t believe me? These two real life stories illustrate exactly what’s at stake.
$2,500/Month on Office Supplies —> Solved with a $500 Print Lease
Years ago, I worked with a 3rd‑party transport operator spending $2,500/month on office supplies. At first glance this seemed impossible, they weren’t huge in the context of non-cannabis 3PL (third party logistics) companies. But once we dug into the data, the problem revealed itself:
- Every manifest required 3 physical copies (one for wholesale, one for retail, one for the transporter).
- If a single data point was wrong, our warehouse compliance team would tear up all the pages and reprint the entire packet. Keep in mind, some manifests were 100+ pages long and this was happening dozens of times per week.
Ink, toner, and desktop-printer wear-and-tear were the hidden cost of doing business that was eating them alive by $30,000 a year.
When we brought in a managed print service provider, the operator:
- Replaced desktop printers with industrial high-volume machines;
- converted variable costs into a fixed monthly lease of $500;
- eliminated waste and reprint costs; and
- saved $24,000 per year, an 18% increase to net income.
During price compression, that 18% isn’t a nice‑to‑have, it’s survival.
50+ Hours/Week to Produce Six Monthly Reports
Another multi state operator had seven departments, marketing, sales, finance, FP&A, production, supply chain, and wholesale producing six key sales reports every month. Together, they spent 50+ hours/week downloading excel files and cleaning spreadsheets, exporting point‑in‑time reports, and chasing data from various systems.
This was skilled labor being used for copy/paste processes instead of decision‑making. Once they switched to a TRUE Business intelligence (BI) platform (one that created cross departmental insights and not siloed to a single software application):
- The workload collapsed to <$5,000 of labor per month.
- Report creation time dropped from weeks to minutes.
- The sales team could finally focus on brand strategy, not clerical work.
- Leadership finally had a single version of truth.
This wasn’t cost‑cutting, it was profit optimization through operational maturity.
Shifting from Reactive to Proactive Operations
So, how can you navigate the change from vendor sprawl and intercompany bottlenecks to operational cohesion? It’s not that you have bad technology, it’s that you have too much misaligned technology. When every department has a technology “solution” that works for them, but none of them connect or support your holistic operation, you have a problem. That lack of integration leads to delays, higher margin for error, added labor costs, and reporting blind spots.
This creates a dangerous illusion of productivity; lots of activity, very little leverage. The real cost here becomes no line of sight from a KPI into data-driven decision. So by the time real insights are surfaced, the opportunity has already passed. That’s the cost of reactive operations: you learn what happened after it already hurt you.
Instead of continuing to bolt on more software, cannabis organizations need to flip the strategy:
- We mapped how data actually needed to flow across departments so a single operational update feeds finance, sales, and inventory automatically.
- We eliminated tools that didn’t serve downstream processes so KPIs persist from system → dashboard → meeting → action.
- We centralized reporting so one input could serve many outputs and teams now spot issues before they become losses.
- We aligned vendors to support visibility, not silos. Now instead of leaders asking “what went wrong last month,” they’re asking “what should we adjust for next week?”
Why This Matters in the Race to the Bottom
When prices are rising, inefficiency hides in the noise. When prices fall, inefficiency is fatal. Operators who survive price compression aren’t the ones with the most software, the biggest teams, or the flashiest reports.
They’re the ones with the fewest handoffs, cleanest data flow, fastest feedback loops, and the ability to act before losses compound.
That’s what vendor optimization really means in cannabis.
Reactive → Proactive
Manual → Automated
Departmental → Enterprise
Lagging indicators → Leading signals
From Surviving to Thriving: Why Operators Must Embrace Data-Driven Efficiency
More tools aren’t the answer. Cannabis operators need connected systems, not siloed dashboards; real-time insight, not manual reporting; and agility at scale, not armies of spreadsheets.
In a price-compressed world, survival isn’t about brute force. It’s about operational maturity.
The operators who will emerge from this cycle stronger are the ones who:
- Invest in business intelligence (BI) systems that consolidate fragmented reporting
- Create clean, integrated financial structures that scale with less overhead
- Leverage automated workflows to free up bandwidth and reduce variable labor costs
- See metrics not as retrospective, but as real-time signals for strategic action
- Simulate what’s likely to happen rather than just reporting on what did happen
- Think about what they can do differently next week instead of ruminating on why they’re behind
- Run their business off live data
Whether it’s tackling cost inefficiencies, eliminating redundant workflows, or redesigning financial architecture to match the realities of a maturing market, the cannabis operators who adopt this mindset will not only survive the race to the bottom, they’ll use it as a strategic advantage.
At some point, nearly every cannabis operator asks the same question: “Why do I have all this software… and still no idea what’s really going on?” The truth? Most cannabis tech platforms weren’t built to tell the full financial story. They might show inventory levels, compliance status, or order activity, but not true SKU-level margins, vendor efficiency, or operational drag. The future belongs to those who act faster, learn quicker, and waste less. To do that, operators need one central source of financial and operational truth.
That means:
- Don’t look for BI in every tool. Look for the tool that connects all your systems into real BI.
- Your POS might track retail sales; but it doesn’t know your payroll and benefits
- Your ERP might track finished goods production; but not your raw materials costing
- Your CRM/Sales might show demand; but not your AR or gross margin by customer
- Choosing tools that work together, not just next to each other.
- Getting help to identify where to cut costs, accelerate insights, and build maturity.
What cannabis operators need is a structured, centralized BI layer that makes all that data useful. The right partner or platform should pull from all the right systems, and answer the questions that matter.
Core Outcomes Over Feature Fatigue
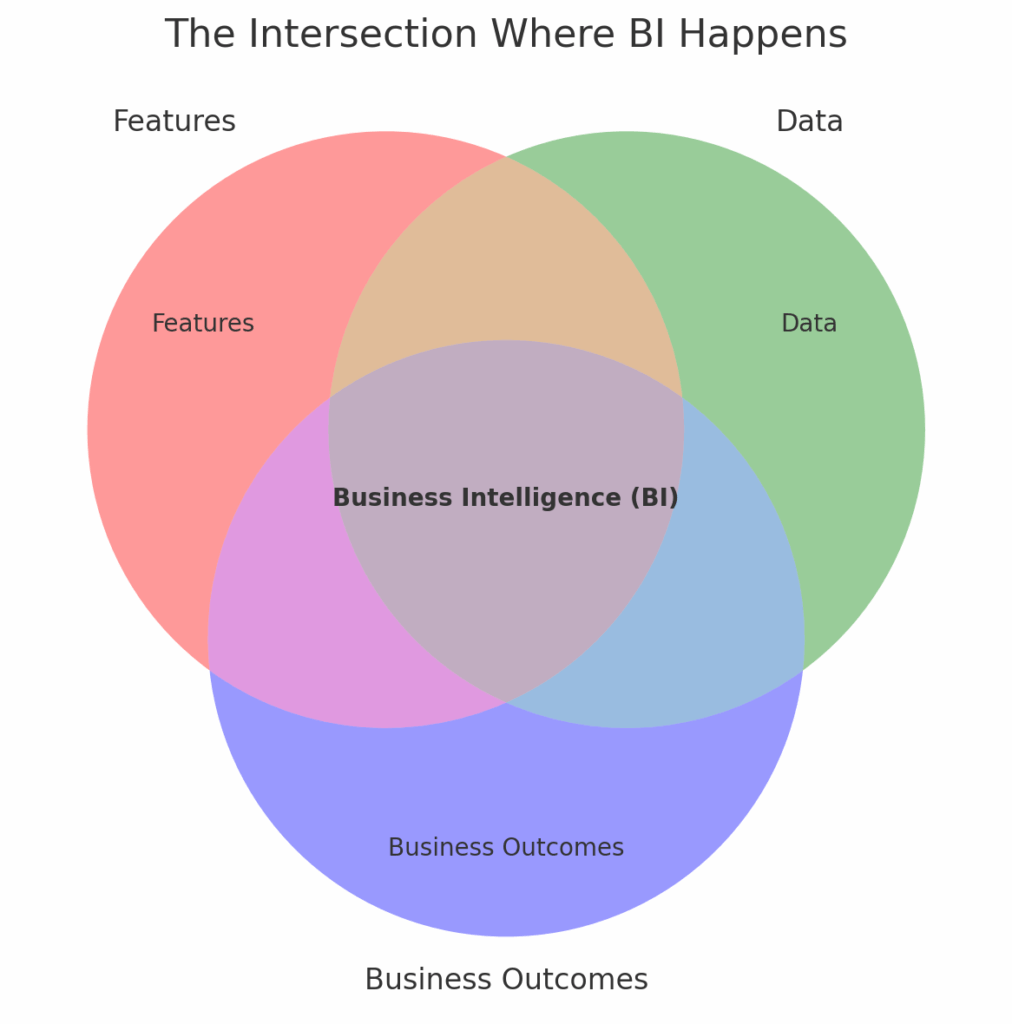
A mature BI foundation enables operators to cut hidden costs, automate reporting, optimize materials usage, improve SKU-level unit economics, track vendor performance & payment terms, forecast inventory, labor, and capital needs, and support S&OP maturity without 10-person finance teams.
This is how high-performing operators separate themselves when price compression starts.
In a post‑price-compression world, efficiency is your moat. Cannabis markets will continue to add supply, hit demand ceilings, experience long-term price compression, and reward the lowest-cost, highest-efficiency operator.
The operators who win will be the ones who waste the least. And surviving the race to the bottom begins with one question: Do you truly understand your hidden costs of doing business?
Find out more about Dominick and how Cannahub helps operators do more with their data here


Sign up for bi-weekly updates, packed full of cannabis education, recipes, and tips. Your inbox will love it.